HHI is fielding many questions regarding the calculations for Length of Stay (LOS). Skilled nursing facilities across the country track the Clinically Anticipated Stay (CAS), otherwise known as Length of Stay (LOS), to determine the amount of days a patient resides in the nursing home. Data collection is the foundation for monitoring progress, but, in itself is a daunting task. CMS uses LOS in the SNF QRP program, for patients discharged to the hospital and for patients who return to the Emergency Room or hospital within 30 days of discharge from the SNF. The accuracy and consistency of these figures is critical for care, operations, outcomes and analysis.
What calculations are being used?
Once the data has been gathered, the analysis begins......but what formula is the one to use? The three most often applied calculations include the Average, the Geometric Mean and finally, the Median.
Average Length of Stay Formula (ALOS)
The most common statistic, which is applicable to many industries, is the average length of stay (ALOS). This average is simply the arithmetic mean of the data. Let d represent the patient days and N represent the total number of patients. Mathematically ALOS becomes,

The LOS data is positively skewed, meaning it has a long tail to the high side. The ALOS calculation is biased by the outliers and gives a misleading assessment.
Outlier examples include patients who are admitted for only one day and return to the emergency room. Patients who remain skilled under Medicare for more than 80 day could be another example of an outlier.
Geometric Mean Formula (GM)
The second statistic, and more accurate, is the Geometric Mean. It is a more precise representation of the central value of an ensemble of points since it is not as sensitive to outliers. Given N patients the geometric mean is the Nth root of the product of the individual patient days. However, the geometric mean calculation is simplified by using natural logarithms as shown below.

Median Formula
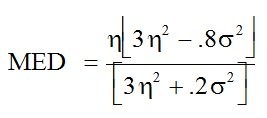
Lastly, the Median statistic is a third alternative. The median is the middle number in a sequence of numbers. Otherwise defined as the 2nd quartile or 50th percentile and best describes the central value of a distribution. Harmony Healthcare International (HHI) compiled the length of stay days for 9552 Skilled Nursing Facility Medicare Patients. The data was taken from homes in New England and New York State between 2012 and 2014. Histograms show that the LOS data follows a Gamma probability distribution. B.M.S.G. Banneheka and G.E.M.U.P.D. Ekanayake well known statisticians in Sri Lanka derived a new point estimator for the median of the Gamma distribution in 2008. The algorithm is based on the ALOS represented by h and the standard deviation of the LOS data. Mathematically,

What formula is the most accurate?
Patient length of stay (LOS) is a metric used in the Prospective Payment System for Medicare reimbursement in Skilled Nursing Facilities (SNF). There is a trend to benchmark the LOS with a single number for prediction and comparison purposes. Conventional wisdom shows that the median is the most meaningful comparison measure for evaluating LOS data.
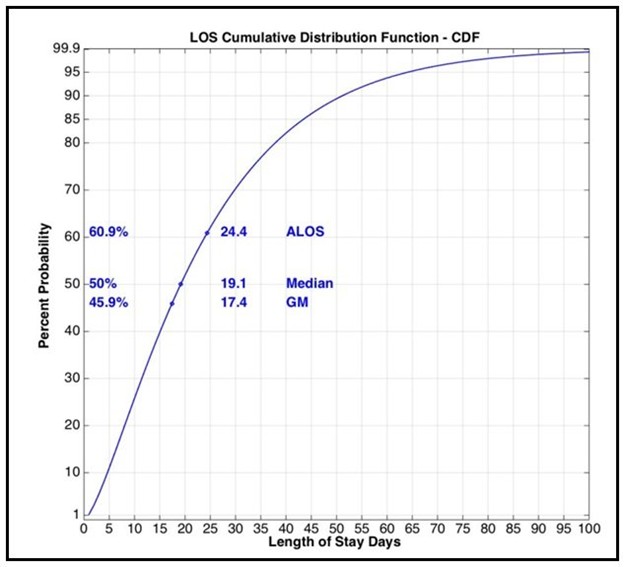
The cumulative Gamma distribution function for the 9,552 HHI patients is presented in Figure 1. This graphic shows the percentile of each length of stay.
- The ALOS is 24.4 days and has a percentile of 60.9%.
- In other words, 60.9% of the stays are 24.4 days or less.
- The median 50% point is at 19.1 days and is the central value.
- The geometric mean on the other hand is 17.4 days and is at the 45.9%.
The conclusion reached is that the Geometric Mean (GM) is more accurate than the Average Length of Stay (LOS) metric used in the Prospective Payment System for Medicare reimbursement in Skilled Nursing Facilities (SNF). There is a trend to benchmark the LOS with a single number for prediction and comparison purposes.
Conventional wisdom shows that the median is the most meaningful comparison measure for evaluating LOS data.
The cumulative Gamma distribution function for the 9552 HHI patients is presented in Figure 1. This graphic shows the percentile of each length of stay.
- The ALOS is 24.4 days and has a percentile of 60.9%.
- In other words, 60.9% of the stays are 24.4 days or less.
- The median 50% point is at 19.1 days and is the central value.
- The geometric mean on the other hand is 17.4 days and is at the 45.9%.
The conclusion reached is that the Geometric Mean is more accurate than the Average Length of Stay. This chart bears that point out. However, unquestionably, the Median provides the best estimate of the central value of a Gamma distributed set of data. This chart bears that point out. However, unquestionably, the median provides the best estimate of the central value of a Gamma distributed set of data.

FIGURE 1
Click Here for FREE PDPM
Revenue and Risk Analysis
Conclusion:
To maintain a viable Medicare program in the skilled nursing facility setting, leadership must analyze the admission and discharge process for the Medicare Part A beneficiary, as well as all other payor sources who are admitted for post acute care.
The key to effectively tracking and interpreting data is ensuring industry wide consistency in the formula.
If you need help with LOS calculations or would like to learn more, please click here to contact Harmony Healthcare International or call us at (800) 530-4413.

Copyright © 2021 All rights reserved — www.harmony-healthcare.com


